Birthdays in Curaçao
When is your birthday, and how many people in Curaçao share it? Civil Registry data on 166,600 registered residents reveals the most and least common birthdays and how birthdays are distributed throughout the year.
The data covers 166,600 residents and reveals variations in the number of people sharing the same birthday, as well as differences in the distribution of births across months. The data was obtained from the Civil Registry and includes every registered resident.
September 17: The most common birthday in Curaçao
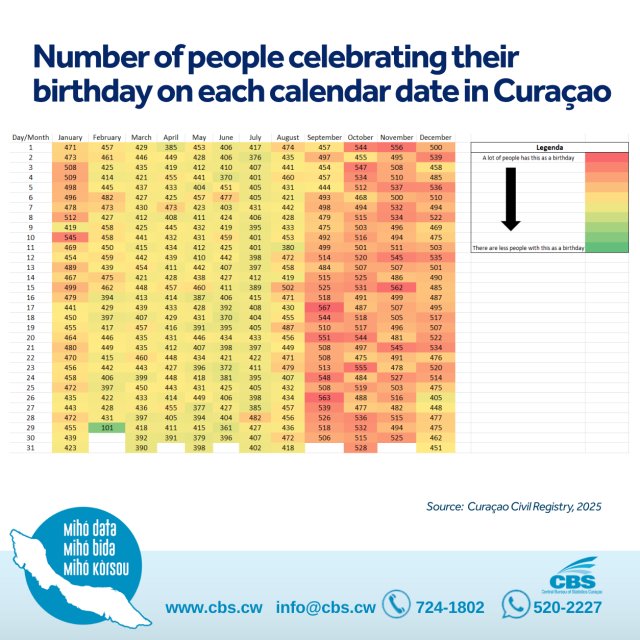
September 17 has the highest number of birthdays in Curaçao, with 567 people celebrating their birthday on this date. It is followed by September 26 with 563 people and November 15 with 562. Other dates with relatively high numbers are November 1 with 556 and October 23 with 555. The five most common birthdays are all in September, October and November.
Among dates that occur every year, June 29 has the lowest number of birthdays, with 361 people. This is followed by June 4 and June 18, each with 370 people, June 23 with 372 and July 2 with 376.
February 29 has 101 birthdays, the lowest number in the dataset. Reason for this is that, unlike other calendar dates, February 29 occurs only in leap years, approximately once every four years.
Table 1 presents the number of people celebrating their birthday on each calendar date, organized by month. The color scale indicates differences in the number of birthdays across the year with greens and yellows being on the lower end of the scale and oranges and red being on the higher ends of the scal
The file may also include people who live abroad but have not deregistered with Kranshi (the Civil Registry).
More birthdays toward the end of the year
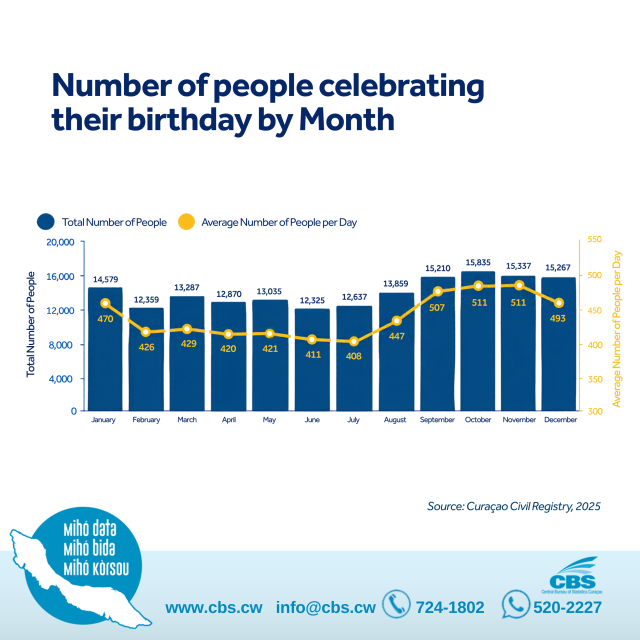
The monthly distribution shows higher numbers of birthdays during the final months of the year, particularly from September through December. October has the highest total number of birthdays, with 15,835 people, followed by November with 15,337, December with 15,267 and September with 15,210.
Since months have different numbers of days, the average number of birthdays per calendar date provides an additional basis for comparison. November has the highest average, with approximately 511 birthdays per date, closely followed by October, also with approximately 511. September records an average of 507, while December and January have averages of 493 and 470, respectively.
The increase is particularly noticeable between August and September. The average rises from approximately 447 birthdays per date in August to 507 in September. It remains above 510 in October and November before decreasing to approximately 493 in December.
June and July have fewer birthdays
The lowest average numbers of birthdays per calendar date are recorded around the middle of the year. July has the lowest average, with approximately 408 birthdays per date, followed by June with 411 and May with 421.
In terms of monthly totals, June has the lowest number of birthdays, with 12,325 people, followed by February with 12,359 and July with 12,637. February has fewer calendar days than other months, making the daily average a more suitable measure for comparing the distribution.
Overall, the monthly averages show a decline from January toward the middle of the year, followed by an increase beginning in August. The highest averages are recorded in September, October and November.
Figure 1 presents the total number of birthdays per month alongside the average number of birthdays per calendar date, illustrating the differences in the distribution throughout the year.